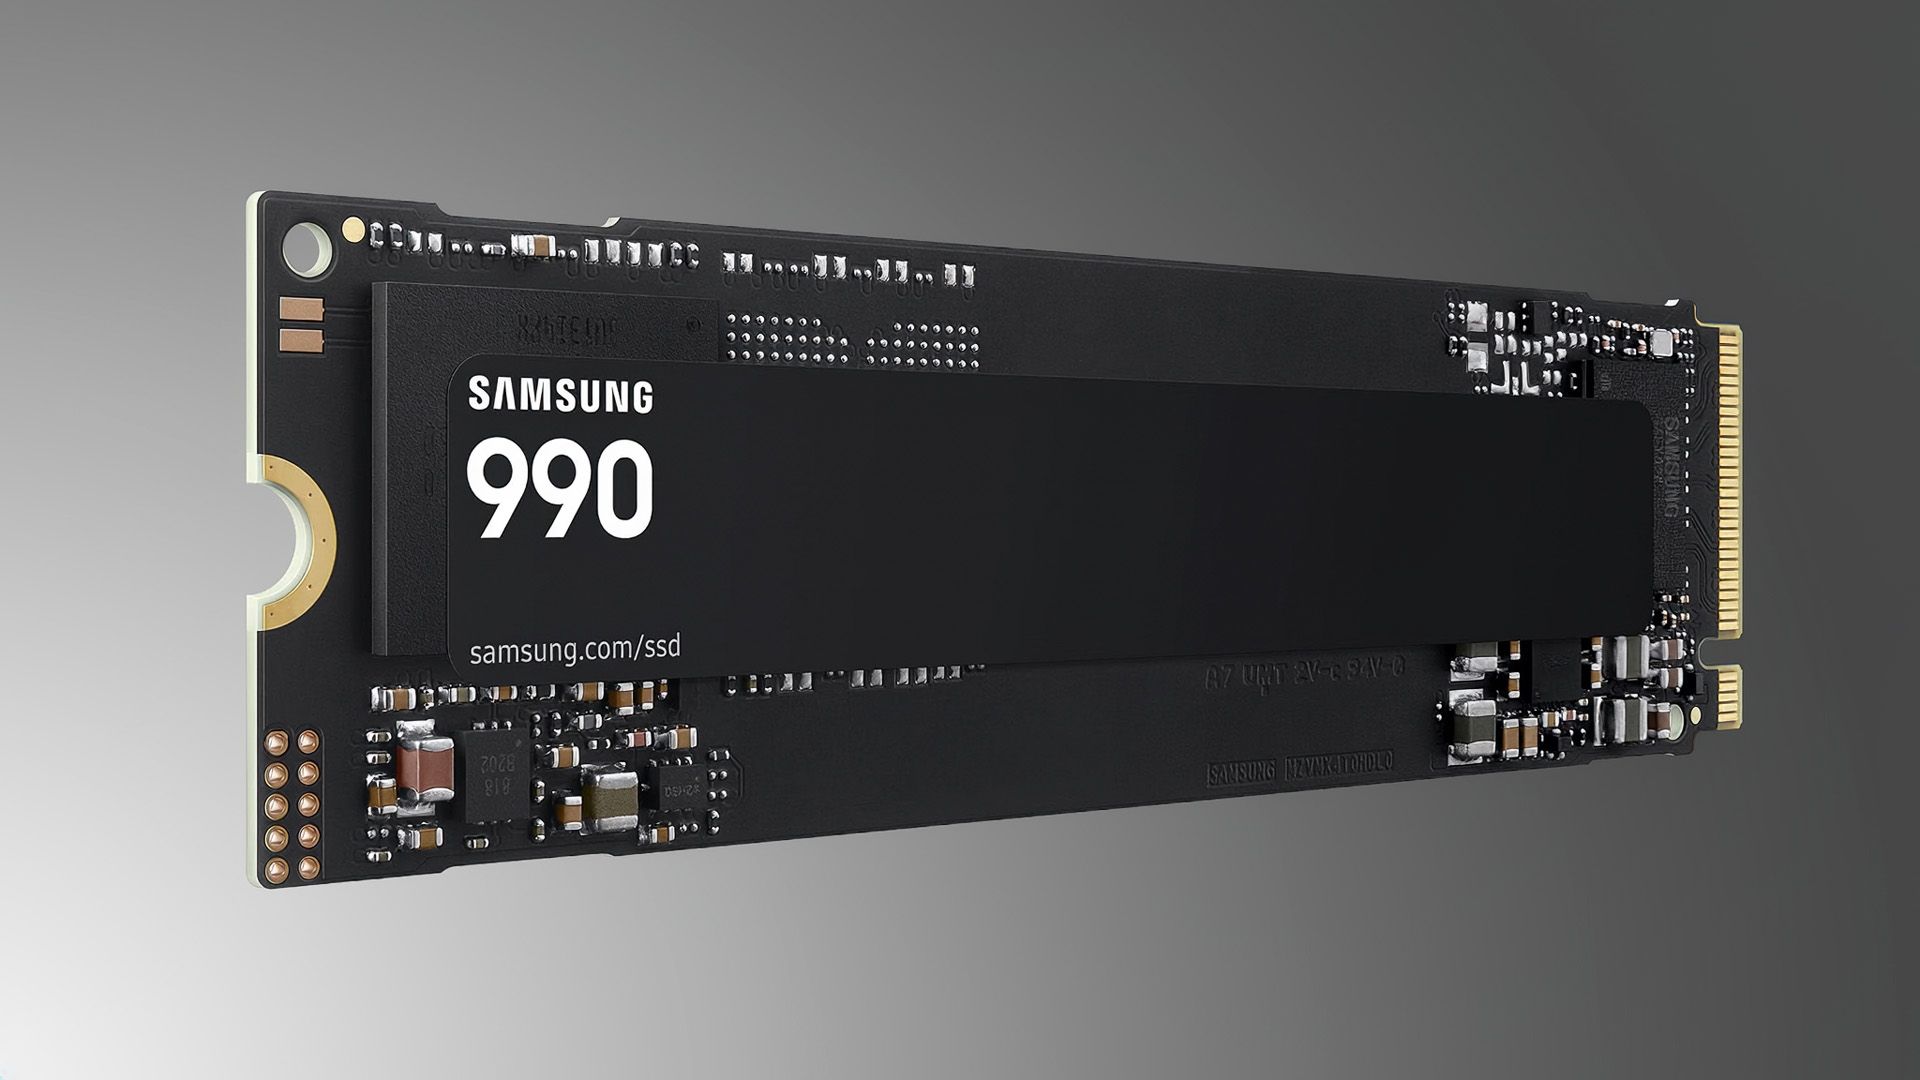
Executive Overview & Market Positioning
The storage market is currently navigating significant supply chain headwinds, characterized by fluctuating NAND and DRAM pricing. In this environment, Samsung’s 1TB 990 NVMe SSD has surfaced at a discounted price point of $189.99. While the nominal $40 discount from its $229.99 list price is modest, the drive’s positioning within Samsung’s portfolio is telling. Utilizing V9 QLC NAND, the 990 targets the value-oriented enthusiast segment, bridging the gap between legacy PCIe 3.0 throughput and the high-end, DRAM-cache-laden drives that command a premium.
From a market standpoint, the 990 represents Samsung’s aggressive play in the budget-conscious sector. By adopting a DRAM-less architecture, the manufacturer has successfully lowered the bill of materials (BOM), passing cost optimizations to the consumer. For users migrating from SATA-based infrastructure or aging HDD arrays, the 990 offers a substantial IOPS uplift. However, its placement against stiff competition—including the WD Blue SN5100 and Crucial P310—suggests that while the Samsung brand equity remains a primary driver, the hardware must compete strictly on a per-gigabyte valuation.
Empirical Benchmark Matrix
Performance metrics for the 990 1TB demonstrate a focus on sustained cache-supported throughput. During real-world testing, the drive achieves peak sequential read speeds of 7,150 MB/s and writes of 6,450 MB/s. Notably, the controller configuration allows for a robust write cache, maintaining high-speed writes for nearly 60 seconds before thermal or cache saturation forces a reversion to native QLC write speeds. The following table summarizes the core hardware specifications relative to standard PCIe 4.0 expectations:
| Feature | Specification | Impact |
|---|---|---|
| Interface | PCIe 4.0 NVMe | Standard high-speed throughput |
| NAND Type | V9 QLC | High density, lower endurance |
| Controller | DRAM-less | Cost-optimized, lighter weight |
| Read/Write | 7,150 / 6,450 MB/s | Competitive for gaming/loading |
| Endurance | 400TBW | Sufficient for standard use |
Thermal, Efficiency & Definitive Verdict
The Samsung 990 is a pragmatic, albeit compromised, solution. While its sequential throughput is commendable, the lack of DRAM cache and reliance on QLC flash results in lower power efficiency and endurance compared to the flagship 990 Pro series. Thermal management is adequate for single-sided M.2 2280 form factor requirements, making it ideal for cramped mini-PC environments, though it trails the P310 in heavy random-transfer operations. Ultimately, for users prioritizing large file storage and gaming, the 990 is a competent upgrade. However, given the three-year warranty period, we suggest treating this as a high-performance secondary drive rather than a critical OS boot volume for professional-grade workstations.